Projects tagged "maps"
This page highlights several of my personal software projects.
Table of Contents
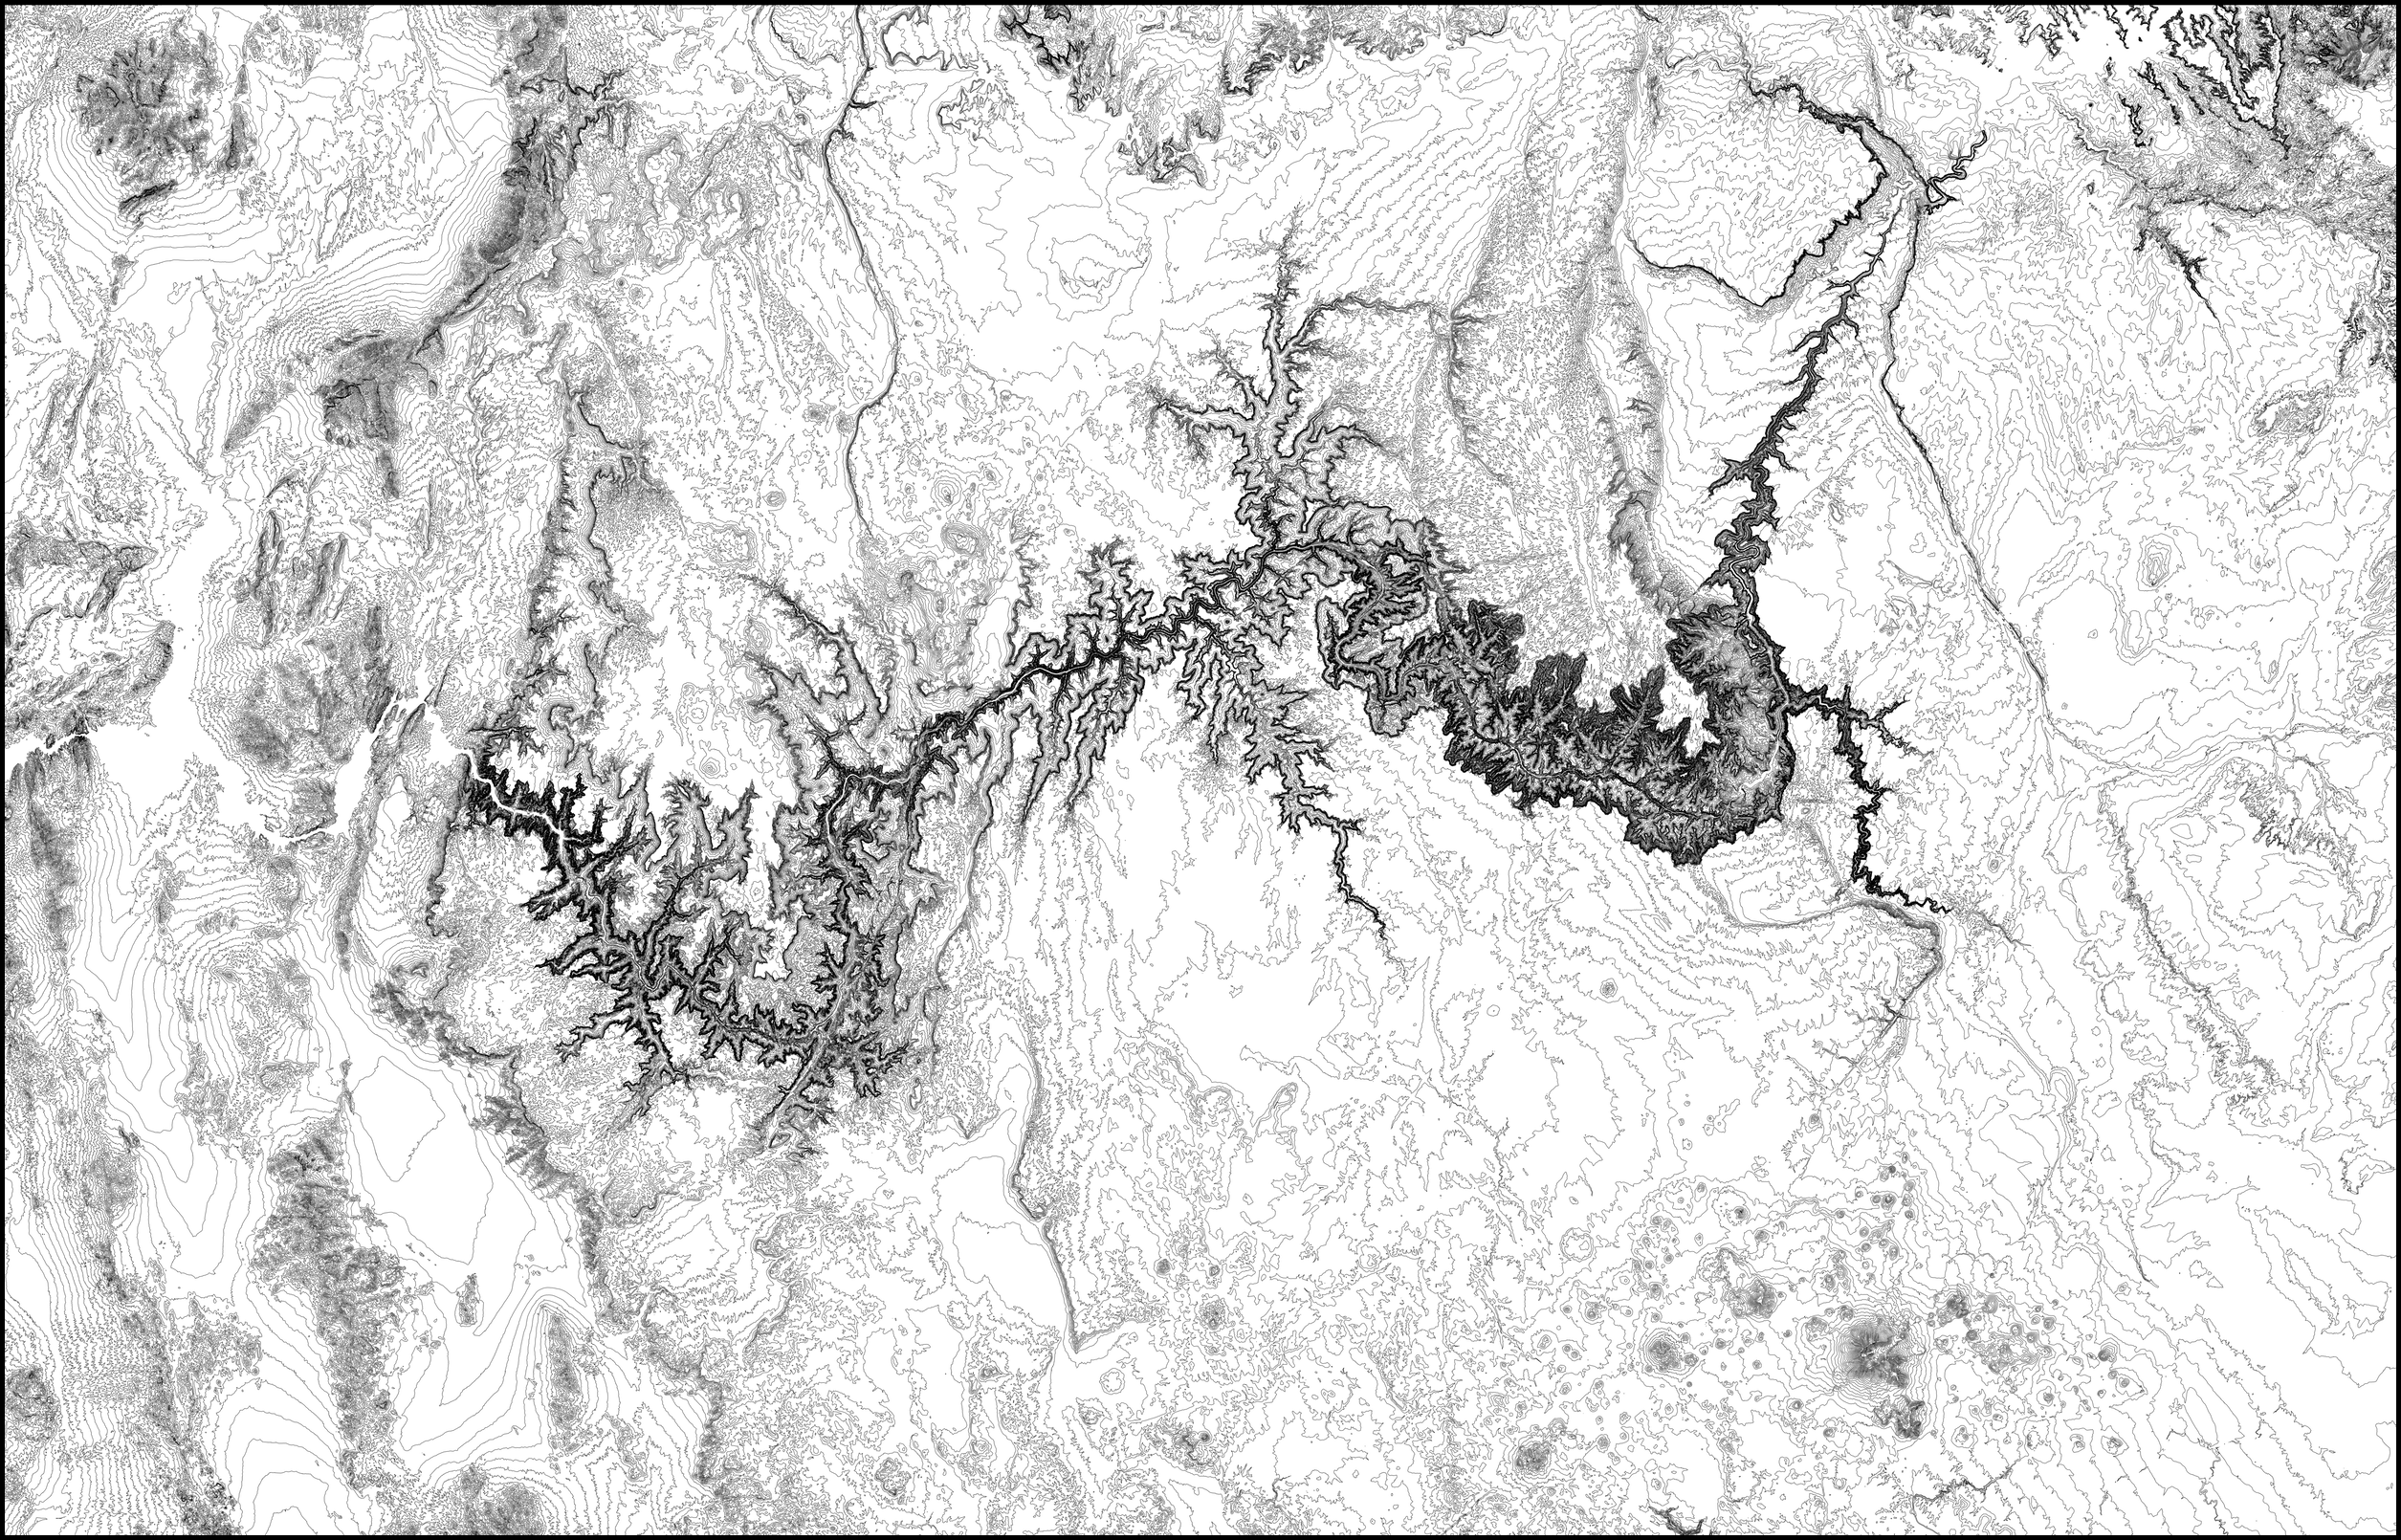
Contour Maps February 2018
Generate vector-based contour maps using AWS terrain tiles.
This code generates topographic maps (using contour lines) based on elevation data. It can automatically fetch and cache terrain tiles from AWS. It can render a region defined by a lat/lng bounding box or by a shapefile (such as for a given country or state). I used this code to draw topographic maps on my AxiDraw pen plotter.
The example below shows the topography of the Grand Canyon and its surroundings with contour lines separated by 50 meters in elevation.
Links: GitHub
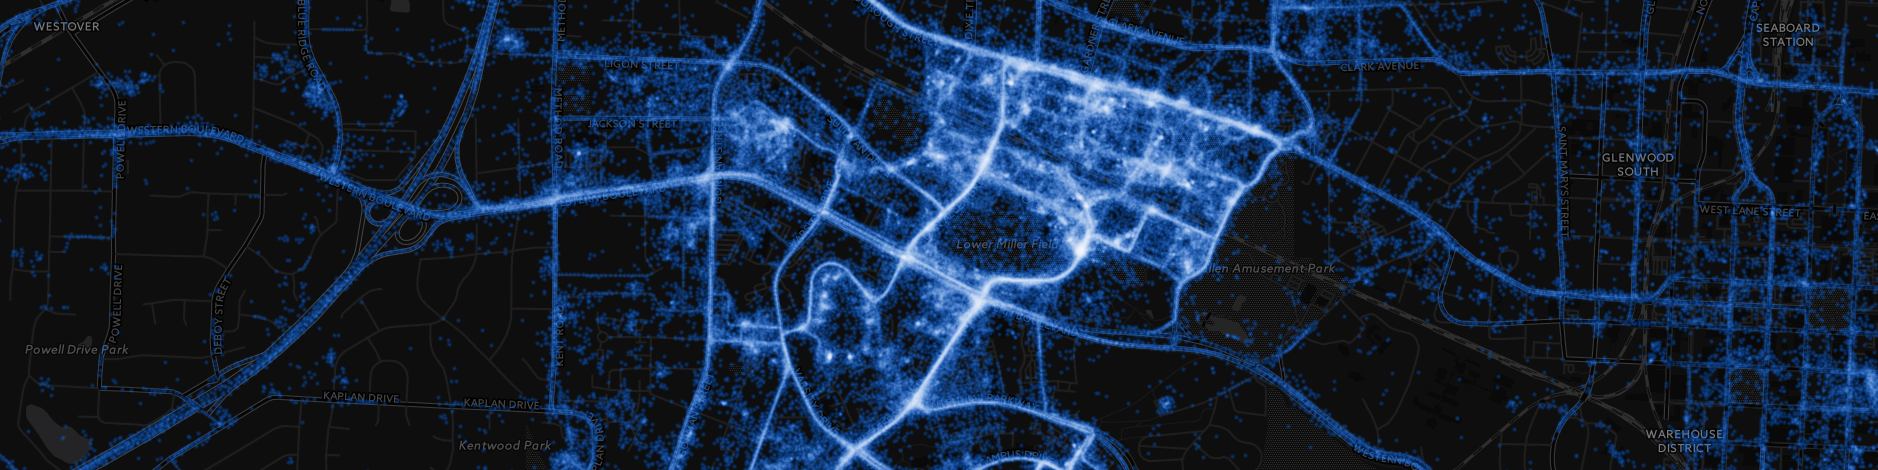
Point Maps April 2016
Custom tile server for rendering millions of points on a map efficiently.
I wrote this as a learning exercise for dealing with huge amounts of data on a map.
The points are stored in Cassandra, where they are clustered by their tile coordinates at a predefined map zoom level. When a tile is requested, the tile server can then quickly fetch the correct points. The points are then rendered onto the tile in a way that looks nice but is very performant. The tile server also caches the tiles on disk.
Links: GitHub • NYC Taxi Visualization
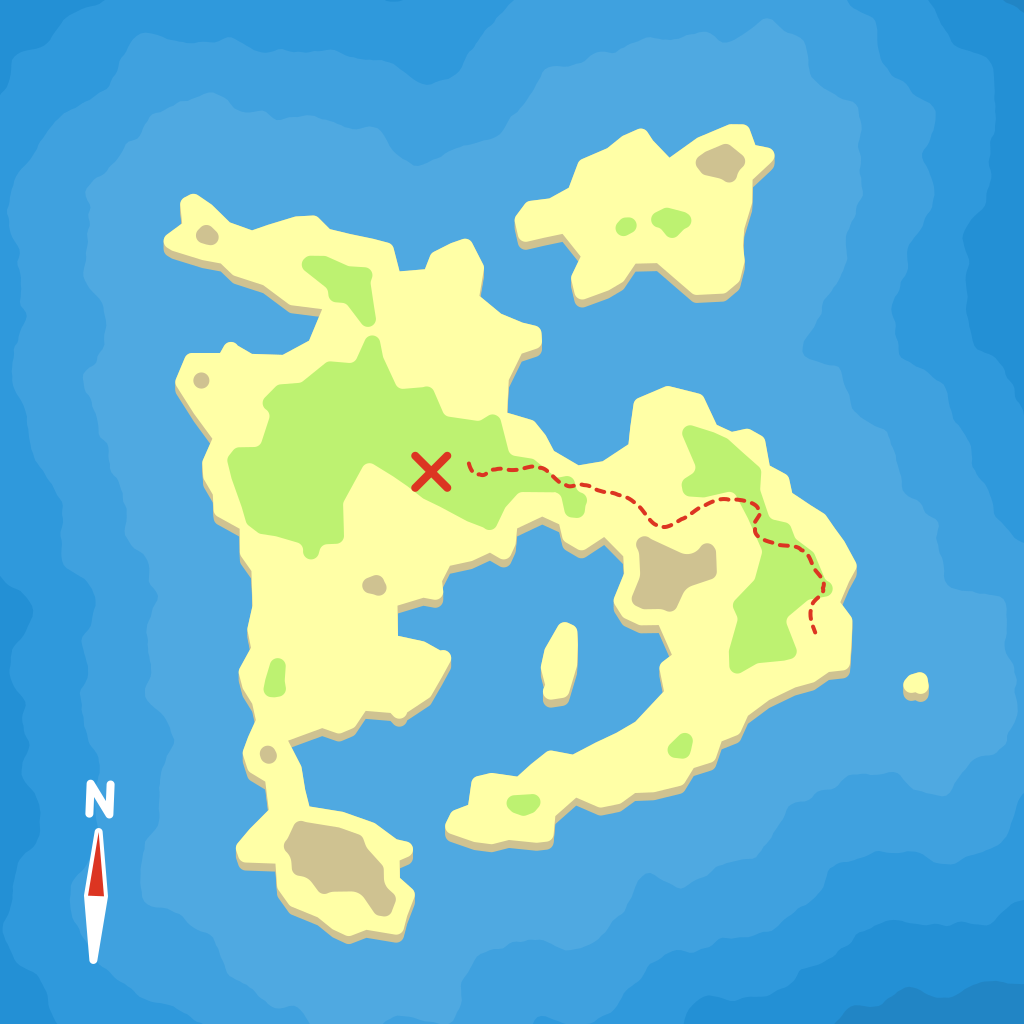
Pirate Maps December 2015
Procedurally generated pirate treasure maps. X marks the spot!
This was my submission in the /r/proceduralgeneration monthly challenge. I used several excellent third party libraries...
cairofor renderingcolourfor color interpolationnoisefor simplex noisePillowfor saving debug images of noise layerspyhullfor delaunay triangulationShapelyfor all kinds of 2D geometry operations
Links: GitHub
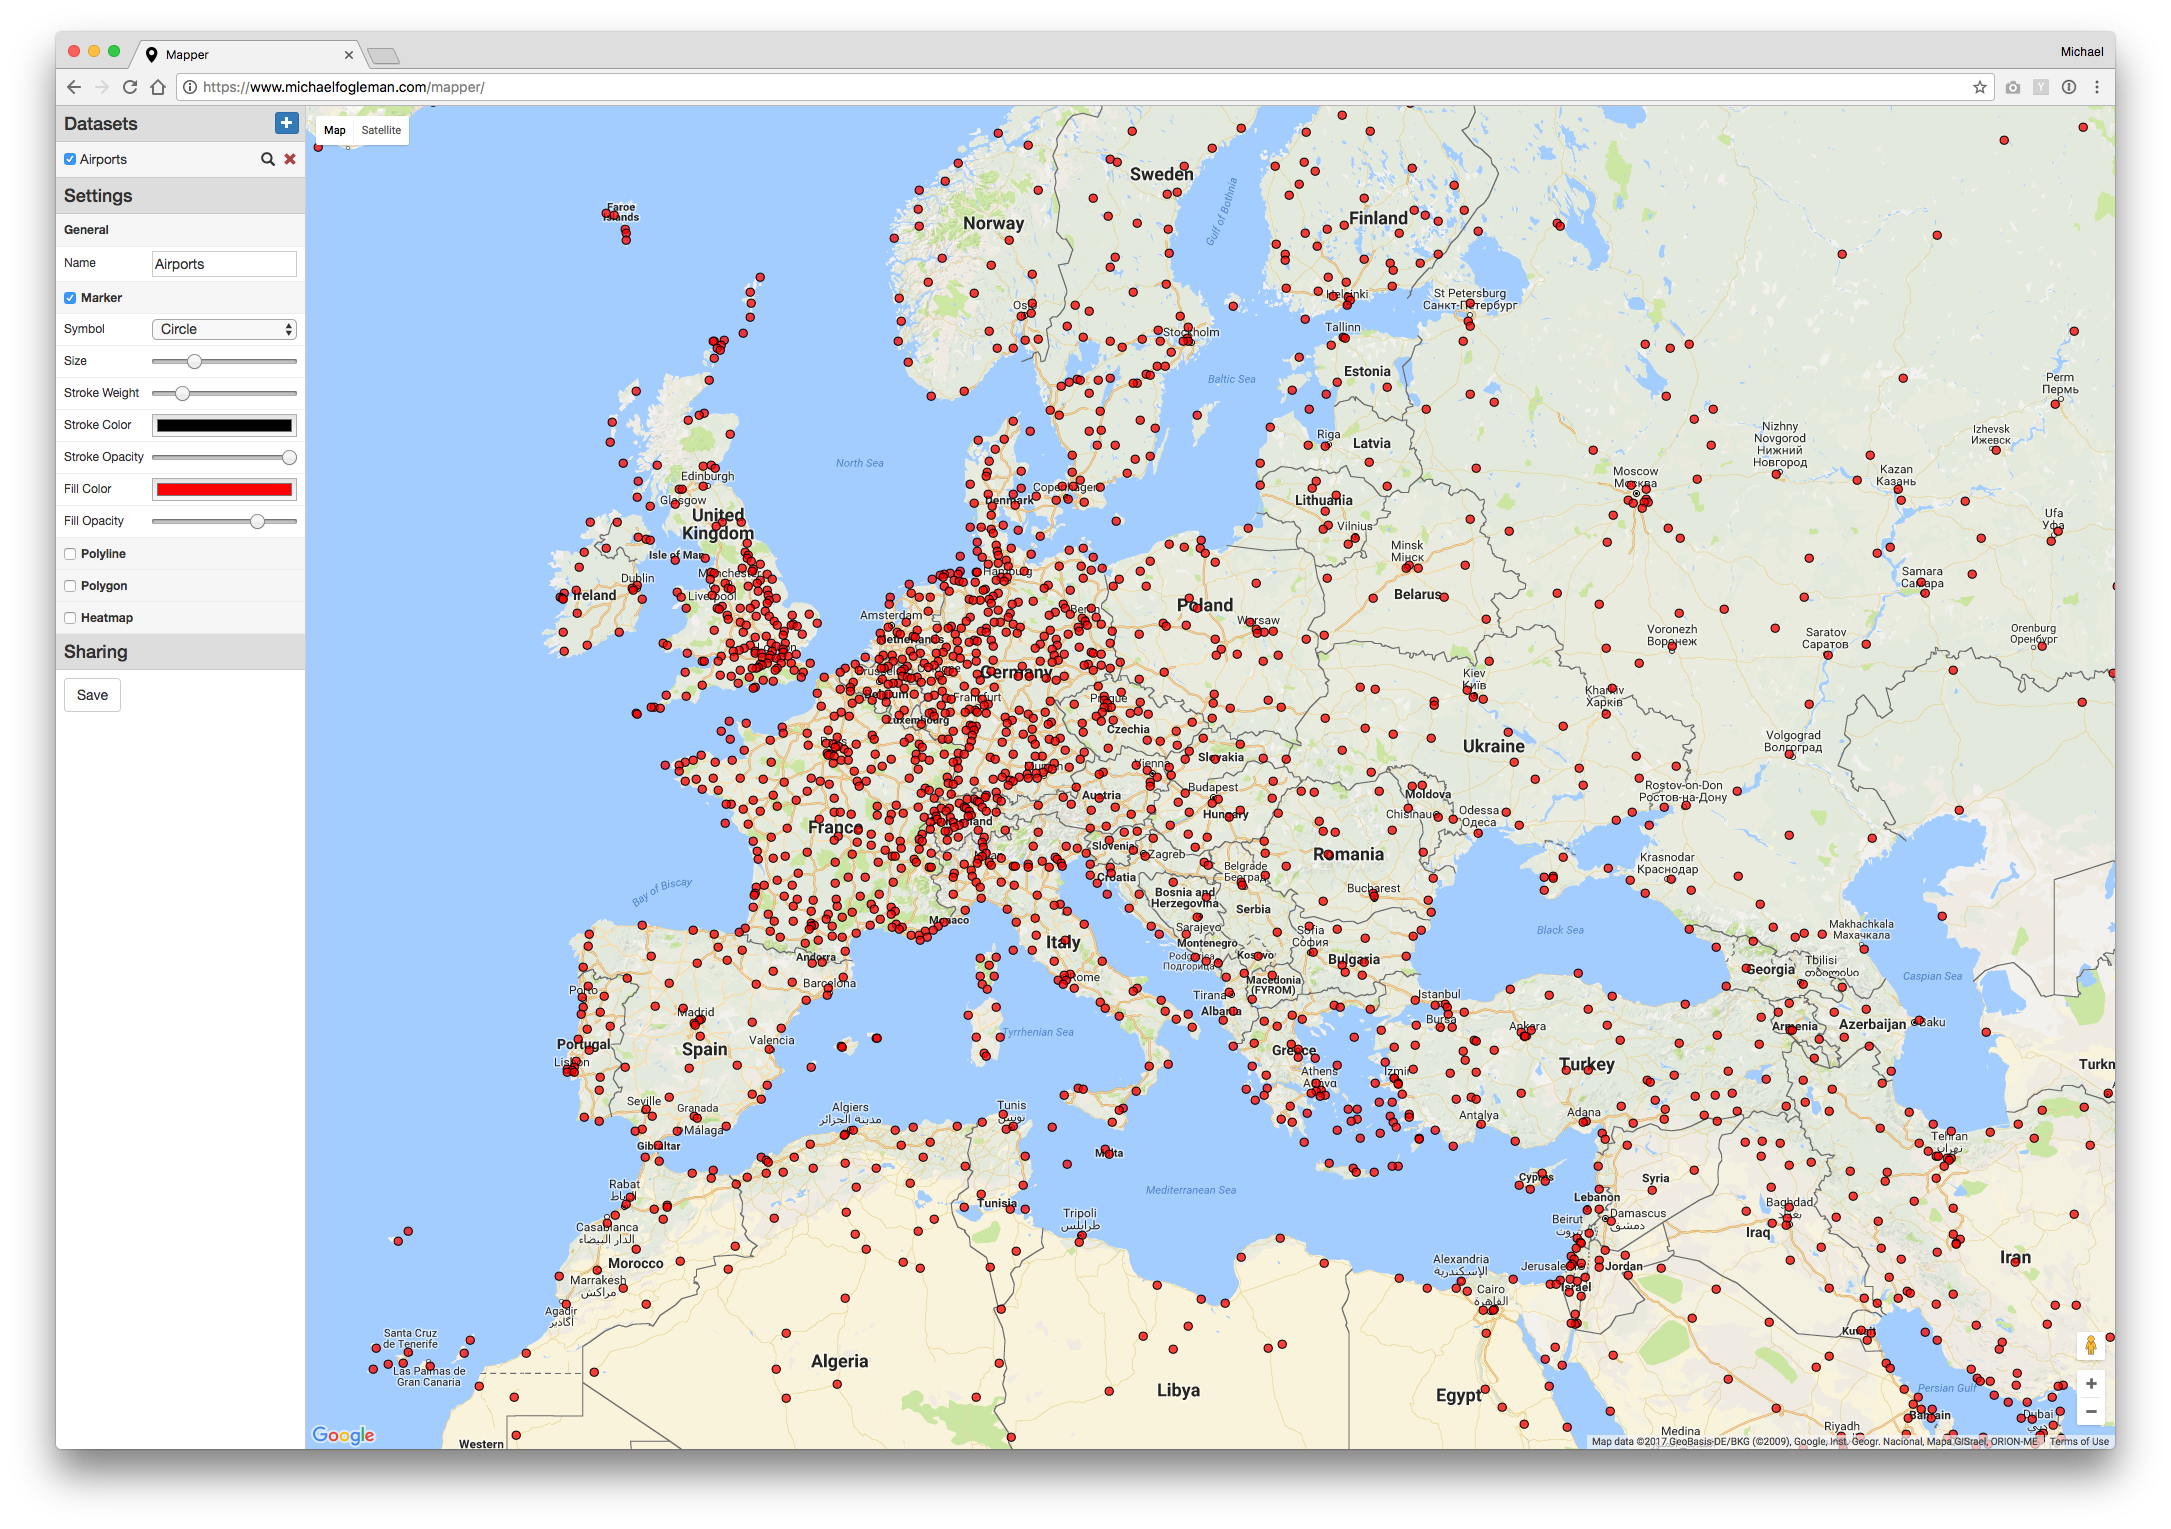
Mapper August 2015
Web app for quickly plotting markers, polylines, polygons, heatmaps, etc. on a map.
Got geocoordinates but don't know how to see them quickly? Just paste them into Mapper! Doesn't matter if it's comma-separated, whitespace-separated, or something else. You can add multiple datasets and each one can be configured to plot different symbols or styles. Once you're happy with the visualization, it even has a button that gives you a link for sharing.